Maps
After almost twenty years of depression and war, 1945 saw Pennsylvania standing on the precipice of growth and change. Maps provide an interesting window through which to view the changes associated with the growth of postwar suburbanization. Aerial maps, county breakdowns of housing data, municipal planning commission maps, and historic topographical maps illustrate more than just the sheer explosion of suburbs in America. Maps offer us the chance to analyze where, when, and how a specific area experienced growth.
Aerial Photography
These images can chart the important physical changes made to the landscape over time. Feel free to browse historic aerials through PennPilot's website, which contains historic aerial photographs of Pennsylvania from 1937-1942, 1957-1962 and 1967-1972.
Useful Links
- Penn Pilot - a project sponsored by the Pennsylvania Geological Survey that contains aerial photography for PA.
Photos
In the example below, note the drastic changes that took place in 30 years along the Delaware River in Ridley Township. Dense population growth has occurred which highly altered the landscape. Click thumbnails for larger images.
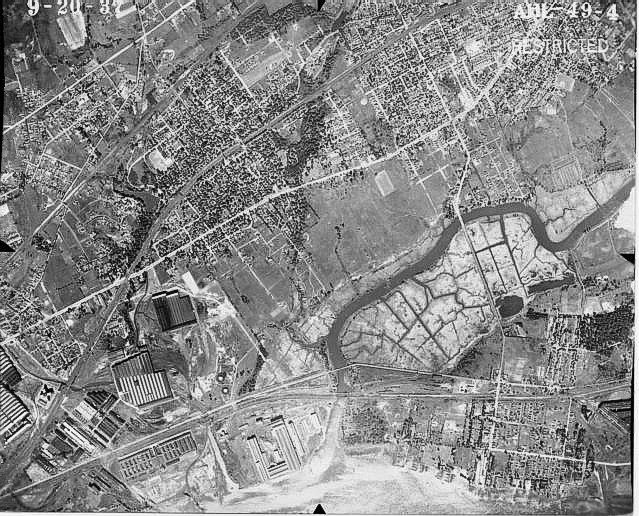 Ridley Park, 1939 |
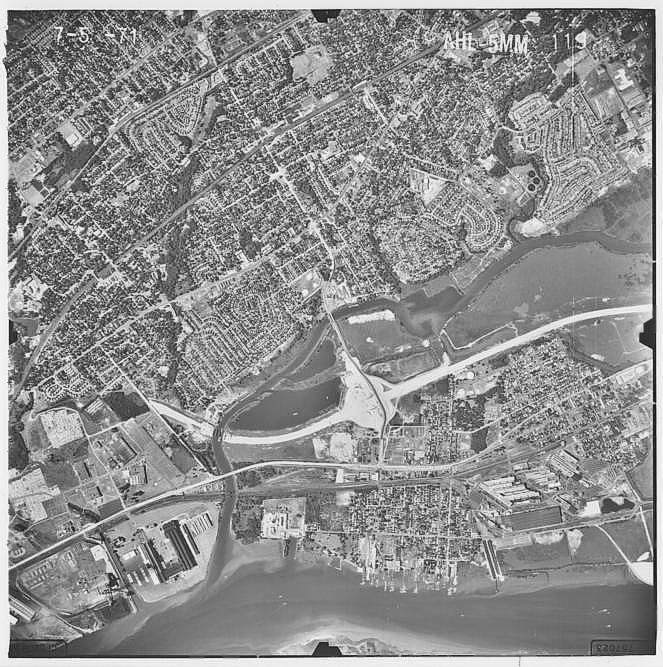 Ridley Park, 1971 |
County and Municipality
Using the resources of the Pennsylvania State Data Center, Pennsylvania Spatial Data Access, and the U.S. Census Bureau, researchers can compile data and create individual maps for profiling statewide, county or municipal suburban development across Pennsylvania. The maps below were created by BHP using ArcGIS Software by ESRI.
Useful Data
- Suburbs Database (Excel file) - If you have access to GIS software, you can download the data used to create the county and municipality maps below.
1940-1960
The following county maps show the increase in housing units between 1940 and 1960 based on the total number of housing units of 1990.
| 1940 - 1960 New Residential Housing Units by Municipality | |||||
|---|---|---|---|---|---|
| Adams | Allegheny | Armstrong | Beaver | Bedford | Berks |
| Blair | Bradford | Bucks | Butler | Cambria | Cameron |
| Carbon | Centre | Chester | Clarion | Clearfield | Clinton |
| Columbia | Crawford | Cumberland | Dauphin | Delaware | Elk |
| Erie | Fayette | Forest | Franklin | Fulton | Greene |
| Huntingdon | Indiana | Jefferson | Juniata | Lackawanna | Lancaster |
| Lawrence | Lebanon | Lehigh | Luzerne | Lycoming | McKean |
| Mercer | Mifflin | Monroe | Montgomery | Montour | Northampton |
| Northumberland | Perry | Philadelphia | Pike | Potter | Schuylkill |
| Snyder | Somerset | Sullivan | Susquehanna | Tioga | Union |
| Venango | Warren | Washington | Wayne | Westmoreland | Wyoming |
| York | |||||
1960-1970
The following county maps show the increase in housing units between 1960 and 1970 based on the total number of housing units of 1990.
| 1960 - 1970 New Residential Housing Units by Municipality | |||||
|---|---|---|---|---|---|
| Adams | Allegheny | Armstrong | Beaver | Bedford | Berks |
| Blair | Bradford | Bucks | Butler | Cambria | Cameron |
| Carbon | Centre | Chester | Clarion | Clearfield | Clinton |
| Columbia | Crawford | Cumberland | Dauphin | Delaware | Elk |
| Erie | Fayette | Forest | Franklin | Fulton | Greene |
| Huntingdon | Indiana | Jefferson | Juniata | Lackawanna | Lancaster |
| Lawrence | Lebanon | Lehigh | Luzerne | Lycoming | McKean |
| Mercer | Mifflin | Monroe | Montgomery | Montour | Northampton |
| Northumberland | Perry | Philadelphia | Pike | Potter | Schuylkill |
| Snyder | Somerset | Sullivan | Susquehanna | Tioga | Union |
| Venango | Warren | Washington | Wayne | Westmoreland | Wyoming |
| York | |||||
The state maps help to give a bigger picture of what was happening in Pennsylvania housing after World War II. We have provided maps of the total housing units, and also percentages. Percentage Growth maps show the percentage growth of housing units based on 1990 totals, meaning that 100% of the houses were built by 1990. The maps account for that percent that was built between 1940 and 1970. For example if you take a look at the 1940-1970 Percentage Growth map one can truly have an understanding of suburban growth within Pennsylvania.
| New Residential Housing by Municipality in Pennsylvania | ||
|---|---|---|
| 1940-1960 New Housing Units | 1940-1960 Percentage Growth | |
| 1960-1970 New Housing Units | 1960-1970 Percentage Growth | 1940-1970 Percentage Growth |
Natural break was used in all of the maps except the maps dealing with percentages. Based on the data we determined the range of percentages used for mapping. Projection used on all maps was State Plain Pennsylvania South Projection.
Historic Maps
Historic Maps can offer multiple dynamics in terms of research into trend and features dealing with suburban growth. Simple internet searches or trips to your nearest library can uncover these sources. We recommend a couple of repositories and search strategies in particular.
Internet Sources
Internet Sources such as MyTopo, the Pennsylvania Spatial Data Access, and Historical Maps of Pennsylvania have topographic maps, modern atlas maps, and road maps that can detail the growth of towns, cities, and outlying areas that is a sign of suburban development. A general comparison of the United States Geological Survey 1:24,000 Quadrangle of Allentown from 1939 to 1957 revealed sizable growth in housing in a number of areas around the city such as this one near Mountainville.
Useful Links
- MyTopo
- Pennsylvania Spatial Data Access
- Historical Maps of Pennsylvania
- PennDOT
- Pennsylvania State Archives
- Pennsylvania State Library
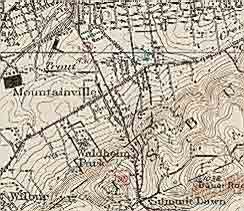 U.S.G.S. Topo Map, Allentown 1939 |
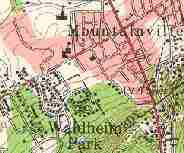 U.S.G.S. Topo Map, Allentown 1957 |
Repositories
Many universities and educational organizations gather geographic materials useful for the study of their particular region. Listed below is a sample of such repositories.
- Historic Pittsburgh's City of Pittsburgh Geodetic and Topographic Suvey Maps, 1923-1961
- Greater Philadelphia GeoHistory Network's "GeoHistory Resources"
Pennsylvania Department of Transportation
PennDOT offers pdf links to historic Official Tourism and Transportation Maps and historic county maps at the PennDOT's website.
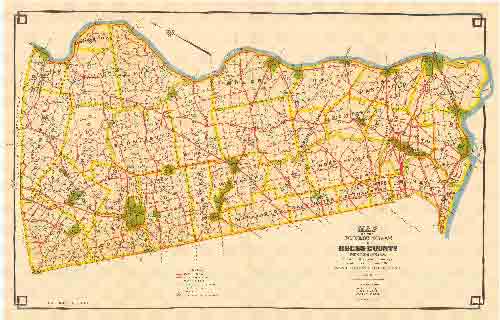 Historic Map of Bucks County, Courtesy of PennDOT |
Pennsylvania State Archives
The Pennsylvania State Archives offers an important collection of historic maps from the postwar period. The example below demonstrates what the Pennsylvania State Archives has in its Map Collection, Manuscript Group 11 for Cambria County.
| Date | Subject | Cartographer/Publisher | Map Number |
|---|---|---|---|
| 1945 | Historical | Wilt | 327-11 |
| 1952 | Traffic Volume | Department of Highways | 822 |
| 1962 | General | Department of Transportation & United States Department of Commerce |
519-11 |
Pennsylvania State Library
The Pennsylvania State Library offers an important collection of historic maps that can chart suburban growth in Pennsylvania. The library's database contains a variety of maps ranging from transportation, zoning to planning commission maps. The example below demonstrates what the Pennsylvania State Library has to offer researchers.
| Map Title | Location | Cartographer/Publisher | Date |
|---|---|---|---|
| Aerial Photographs as Tax Maps | Harrisburg | Pennsylvania State Planning Board | 1952 |
| Annin Township Zoning Map | Erie | Neathery - Norton Associates | 1955 |
| A part of the Comprehensive Master Plan for the Borough Planning Commission, Donora Borough |
Monroeville | Donora Planning Commission | 1965 |
| Philadelphia and Vicinity | Philadelphia | N/A | 1955-56 |
| Map of the Borough and Suburbs of Phillipsburg | Phillipsburg | N/A | 1958 |